Abstract
Orientation: Market events during the coronavirus disease 2019 (COVID-19) pandemic exposed flaws in the econometric models used to derive International Financial Reporting Standards (IFRS) 9 impairments. Models were unable to capture the level of government intervention or predict the economic recovery process because of the unprecedented nature of the pandemic.
Research purpose: This study examines the causes of the challenges experienced with the IFRS 9 models during the pandemic and approaches to minimise this risk in the future.
Motivation for the study: Structural correlation breaks forced banks to replace the IFRS 9 models with expert overlays or rapidly rebuild the models to reduce impairment volatility and manage the impact on earnings. Expert judgement may lead to biased outcomes.
Research approach/design and method: Behavioural finance theory suggests that emotion and cognitive biases often lead to irrational investment decisions with disastrous consequences to the market. The link between market sentiment and economic outcomes is tested with natural language processing. Archimedean copulas are used to compare the dependence structures of market variables between different stress periods.
Main findings: Market sentiment is closely related to the trends observed in major macroeconomic indicators. The nature of the dependence structures differs between stress periods.
Practical/managerial implications: Sentiment may be a valuable exogenous variable to incorporate into economic forecast models. Learnings from one stress period are not necessarily applicable to another.
Contribution/value-add: Government intervention and market sentiment had a significant impact on the economic outcomes and correlation breaks observed during the pandemic. Developing bespoke models for the different phases of the economic cycle may not necessarily lead to improved outcomes.
Keywords: Archimedean copula; behavioural finance theory; narrative economics; textual analysis, ARIMA-GARCH; sentiment analysis; IFRS 9; model risk; FinBERT.
Introduction
This study examines the causes and consequences of the flaws exposed in the econometric models used to derive the International Financial Reporting Standards (IFRS) 9 impairments during the coronavirus disease 2019 (COVID-19) pandemic (Canals-Cerda 2022; Laurent et al. 2020; Marlin 2021). Approaches to minimise this risk in the future are explored.
The International Accounting Standards Board (IASB) issued IFRS 9 to ensure the timely recognition of expected credit losses (impairments) to reduce the risk of procyclicality and ensure a stable financial system (IASB 2001, 2014). The IFRS 9 requirements led to the development of complex quantitative models with a strong focus on the inclusion of forward-looking information, usually macroeconomic scenarios (Global Public Policy Committee 2016). Volatility and market uncertainty caused the models to fail during the pandemic. Banks had to replace models with expert overlays or rapidly rebuild the models (European Banking Authority 2021; Laurent et al. 2020; Marlin 2021). Supervisors and regulators responded swiftly by providing guidance to reduce volatility in the outcomes and thereby ensuring the stability of the financial system (Awad et al. 2020).
A government response was required to stop the spread of the virus and limit the economic impact. Lockdowns implemented not only had a social impact but also highlighted the economic and financial impact of social media. Lazzini et al. (2022) refer to a hyperreality generated by highly subjective views published without any filters. There was a significant shift in investor preference during the pandemic (Tsatsaronis et al. 2022), which possibly highlights the difference between the efficient market hypothesis and behavioural finance theory. The efficient market hypothesis states that asset prices are determined on fundamental information available in the market, whereas more recently behaviour finance theory postulates that asset prices are impacted significantly by investor reaction and perception of that information, especially during periods of stress. Emotions can lead to inefficient and irrational investment decisions with disastrous consequences to the market (Kapoor & Prosad 2017; Paule-Vianez, Gómez-Martínez & Prado-Román 2020).
The first part of this study applies natural language processing to the global economic outlook published by the World Bank and International Monetary Fund (IMF) to evaluate how the sentiment in the economic texts changed during the stress period. Policymakers recognise the importance of shaping beliefs and managing expectations as a means to maintain financial stability (Svetlova 2021).
The focus is then shifted to a sentiment analysis of the economic outlooks published by the Organization for Economic Co-operation and Development (OECD) specifically for South Africa. The sentiment is compared with the trends observed for selected macroeconomic variables. This study contributes to existing literature by demonstrating how sentiment may improve the outcomes of econometric models, which has important implications for the way in which the IFRS 9 forward-looking information is generated. The importance of model governance is emphasised.
In the second part of the study, the dependence structures between a set of currencies, stocks, commodities and interest rates are analysed with bivariate Archimedean copulas. The goal is to consider whether the type and level of dependence change over time. This study extends the recent work by researchers such as Kim and Jung (2021), Aslam et al. (2022) and Mzoughi, Ghabr and Guesmi (2022) by also comparing the dependence structures between different stress periods. The dependence structures observed during the global financial crisis 2009–2010 are compared with the dependence structures during the pandemic in 2020.
The article is organised as follows: ‘Literature review’ section covers a literature review of events during the pandemic that are important in the context of the IFRS 9 model breakdowns experienced. In ‘Sentiment analysis’ section, the sentiment in the published economic outlooks from 2008 to 2022 is analysed. ‘Dependence structures’ section compares the behaviour of bivariate dependence structures during different stress periods employing Archimedean copulas. The importance of first ensuring the stationarity of the data with an ARIMA-GARCH filter is explored. Conclusions are drawn in ‘Concluding remarks’ section.
Literature review
The COVID-19 pandemic forced government intervention to contain the spread of the virus and mitigate the economic impact. Lockdown restrictions had significant impacts on industries such as aviation, tourism and leisure, and speciality retail (S&P Global Market Intelligence 2022). The lockdowns resulted in mass production shutdowns and supply chain disruptions. Higher unemployment and changes in consumer behaviour (lower consumption) led to a significant decrease in economic growth. Governments responded by easing fiscal and monetary policy. Tsatsaronis et al. (2022) observe the countercyclical policy response was different from policy reactions in past recessions. The change in policy response caused fundamental shifts in the observed relationships between economic variables as analysed in studies such as Dong, Song and Yoon (2021) and Aslam et al. (2022). Structural correlation breaks, which are frequently observed during economic downturns, cause econometric models to fail because the models were developed under different macroeconomic conditions (Kiefer & Mayock 2020). As econometric models are simplified representations of very complex systems, incidents leading to distributional shifts, non-stationarity and incorrect assumptions about convergence to an equilibrium increase the risk of model failure (Hendry 2017; Stiglitz 2018).
The IFRS 9 models include econometric models used to generate economic scenarios (the required forward-looking information), as well as models that link the economic environment to the credit risk associated with clients and projects. The IFRS 9 models are used to predict the expected credit loss the bank may experience under different economic conditions. The forward-looking information covers all the different segments of the economy such as the stock market, foreign exchange, inflation, interest rates, consumption, economic growth, credit extension and real estate, to name a few.
The pandemic caused considerable challenges with the IFRS 9 impairment models, and the econometric models used to derive the required forward-looking information (Canals-Cerda 2022; European Banking Authority 2021; Laurent et al. 2020; Marlin 2021). Models were unable to quantify the degree of government intervention and effectively determine the economic recovery process because of the unprecedented nature of the pandemic. Correlation breaks and extreme market movements meant the economic scenarios generally did not adequately capture market events and had to be rapidly updated each time new events unfolded, incorporating significant expert judgement. Uncertainty in the economic outlook led to volatility in the IFRS 9 impairments, which has a negative impact on the earnings quality of banks (Stander 2021). Breakdowns in the relationship between economic variables and the credit quality of clients caused further complications. Banks managed the uncertainty around the model outcomes with expert impairment overlays (Breeden et al. 2021; Marlin 2021).
An interesting question is to what extent social media and news increased market volatility and uncertainty during the pandemic. Shiller (2017) proposes the idea of narrative economics that refers to the study of how the spread of popular narratives, stories and news impact on society perception, human emotion and ultimately lead to economic fluctuations. Narratives have a causal impact on the economy and can be considered an exogenous force that may be useful to explain behaviour during periods of economic shock where historical relationship breakdown (Bilan et al. 2019). Behavioural finance theory highlights the necessity of understanding the psychology of investors to explain market anomalies and predict and mitigate the impact of future economic crises (Kapoor & Prosad 2017; Paule-Vianez et al. 2020).
Sentiment analysis relates to the natural language processing of texts such as financial statements, economic outlooks, news and social media with the aim to measure the emotional content and polarity. Algorithms indicate whether a statement is positive, neutral or negative. The outcome can be used to enrich econometric models and to monitor economic impacts in real-time as opposed to the more traditional nowcasting approaches used to deal with delays in the official publication of the macroeconomic variables (Consoli, Barbaglia & Manzan 2022). Media sentiment has been shown to improve economic forecasting (Tilly, Ebner & Livan 2021).
Some of the challenges with the IFRS 9 models during the pandemic can be explained by fluctuations in dependent structures (correlation breaks). Archimedean copulas are versatile tools for determining the type of dependence and the strength of a relationship between variables (Nelsen 2006). Many studies consider how the dependence structures have changed during the pandemic (Aslam et al. 2022; Kim & Jung 2021; Mzoughi et al. 2022) but it is also important to look for similarities in the dependence structures between different stress periods.
Sentiment analysis
Sentiment analysis is the process of analysing the sentiment/emotion captured in economic publications using natural language processing.
In this study, a sentiment analysis is first performed on the global economic outlook published by the World Bank and IMF from 2008 to 2022, to explore how the tone in the texts changed during the pandemic. The focus is then shifted to the economic outlook published by the OECD for South Africa from 2016 to 2021. The sentiment is compared with the trends observed for selected macroeconomic variables. The intention of the study is to explore whether sentiment analysis can improve economic forecast models.
Data
Table 1 summarises the data and data sources used in this study.
| TABLE 1: Description of the South African variables used in the study. |
Methodology
The Natural Language ToolKit (NLTK) is used to transform the textual data into numerical units. Natural Language ToolKit is an open source natural language processing platform for Python (Bird, Klein & Loper 2009; Python Core Team 2019). FinBERT is a sentiment analysis tool that takes into account the specialised nature of financial language. The FinBERT model is based on Bidirectional Encoder Representations from Transformers (BERT) by training it on a financial corpus. Bidirectional Encoder Representations from Transformers is a deep learning model in which every output element is connected to every input element, and the weightings between them are dynamically calculated based upon their connection (Araci 2019; Bonta, Kumaresh & Janardhan 2019).
The sentiment analysis is performed by first tokenising the text into words and then removing the stop words, numbers and symbols. The words are then lemmatised to get the root words. The updated sentences are analysed with FinBERT and assigned a positive, negative or neutral score. The FinBERT scores range from −1 (negative sentiment) to 1 (positive sentiment).
Results
The word clouds in Figure 1 illustrate how the global economic outlook changed from 2019 to 2022. The top two word clouds depict the World Bank global outlook published in 2019 and 2020, respectively (World Bank 2019, 2020). In 2019, the economic outlook focussed on trade tensions and elevated food prices because of more frequent severe weather events. In 2020, the outlook shifted to the pandemic and recession. The bottom word cloud portrays the IMF global economic outlook published in April 2022 (IMF 2008–2022) where the focus now shifted to the Russian war with Ukraine and concerns around elevated inflation globally.
 |
FIGURE 1: The word clouds indicate how the global economic outlook changed from 2019 to 2022; the top two summarise the World Bank global outlook published in 2019 and 2020, respectively, and the bottom one summarises the International Monetary Fund global economic outlook published in April 2022. |
|
Figure 2 shows how the sentiment in the IMF economic outlook changed from 2008 to 2021. The analysis was performed on the executive summary in each of the texts. Each publication’s proportion of positive, negative and neutral sentences is displayed. The negative sentiment in 2015–2016 was influenced by concerns around lower growth in emerging market economies impacted by factors such as increased financial market volatility, lower commodity prices, rebalancing in China and geopolitical factors. The level of negative sentiment was very similar to that experienced during the COVID-19 pandemic. Interestingly, the sentiment has shifted from negative to neutral between 2018 and 2021.
 |
FIGURE 2: The line plots indicate how the sentiment extracted from the International Monetary Fund global economic outlook changed from 2008 to 2021 by comparing the proportion of positive, negative and neutral sentences. |
|
The OECD publishes an economic outlook twice a year (OECD 2016–2022). The sentiment scores are calculated based on the published economic outlook for South Africa. The scores are calculated for each sentence with FinBERT and then the average score is calculated across all the sentences. Figure 3 shows a comparison of the sentiment score with the BCI and NRFI, respectively, when incorporating a 6-month lag. The observed trend of the sentiment score is in line with the trends of the economic variables and the lag implies that the sentiment score can be used to predict the economic variables.
 |
FIGURE 3: A comparison of the compound sentiment score derived with FinBERT from the Organization for Economic Co-operation and Development economic outlooks for South Africa from 2016 to 2021 and the observed BCI and NRFI variables, respectively (incorporating a 6-month lag) (a-b). |
|
Figure 4 compares the trend of the sentiment score with the SA real gross domestic product (GDP). The top graph shows that up to January 2020 the trends are very much in line. The bottom graph shows that at the onset of the pandemic there has been a shift in the trend; the sentiment score lagged by 6-months follow the observed trend for the SA economic growth more closely.
 |
FIGURE 4: A comparison of the compound sentiment score derived with FinBERT from the Organization for Economic Co-operation and Development economic outlook for South Africa from 2016 to 2021 and the observed gross domestic product (a-b). |
|
Summary
The global economic outlooks published by the World Bank and IMF highlight how the focus has shifted from concerns around trade tensions to the pandemic in 2020, and then finally the Russia–Ukraine war in 2022. The trends identified in the sentiment analysis of the OECD economic outlook for South Africa are consistent with major macroeconomic indicators, suggesting that the sentiment analysis score could be a meaningful exogenous impact to include in economic forecast models, also explored in Tilly et al. (2021).
Economic forecast models are key in generating the forward-looking information required by IFRS 9. It is important to have models that not only capture objective information from historical trends but also the subjective information from market sentiment in line with behavioural finance theory. The sentiment analysis provides a quantitative technique to update econometric models with subjective data. Incorporating sentiment scores into the forward-looking information used to derive the IFRS 9 impairments may improve the accuracy and reduce the volatility in the economic forecasts experienced during stress periods.
Dependence structures
Bivariate Archimedean copulas are utilised in this section to examine the behaviour of dependent structures across time and look for similarities between different stress periods. The two stress periods considered are the global financial crisis in 2009–2010 and the COVID-19 pandemic in 2020. Specific consideration is given to the relationship between emerging market currency pairs over time; the dependence structures between the commodity price and stock price of companies exposed to the performance of the specific commodity; and the relationship between the government bond yield and currency. Refer to Table 1 for an explanation of the data used.
Part of the challenges experienced with the IFRS 9 models during the pandemic in 2020 were caused by correlation breaks between economic variables, as well as correlation breaks between the economic variables and the credit risk associated with the bank’s clients. The intention of this study is to analyse whether learnings from one stress period can be used to improve the estimates in another stress period.
Methodology
ARIMA-GARCH models are used to first filter the economic data for non-stationary trends and time-dependent volatility. If non-stationary data are not managed it can lead to spurious relationships (Hendry & Pretis 2016). The ARMA (pA, qA)-GARCH(p, q) model formulation for a time series yt is:
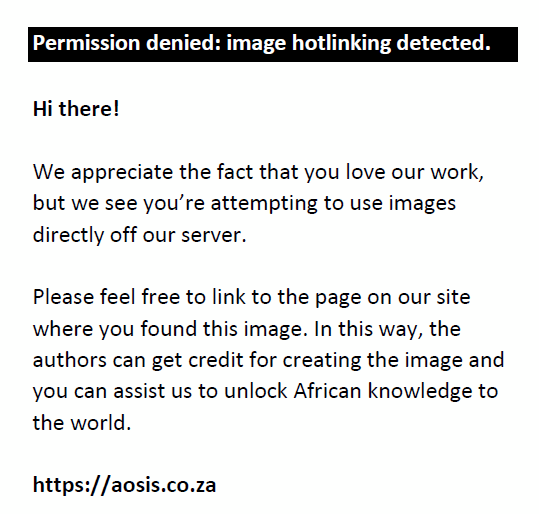
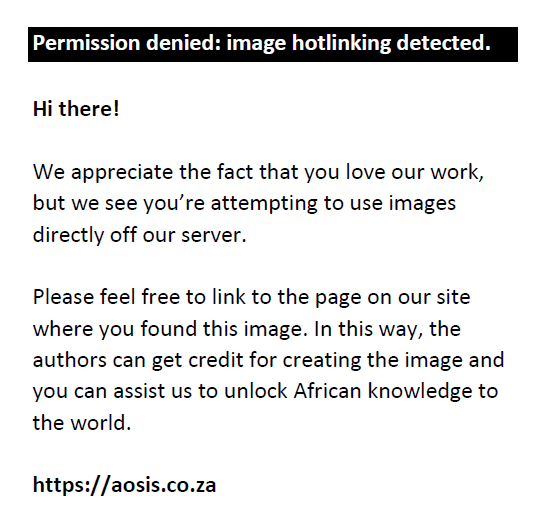
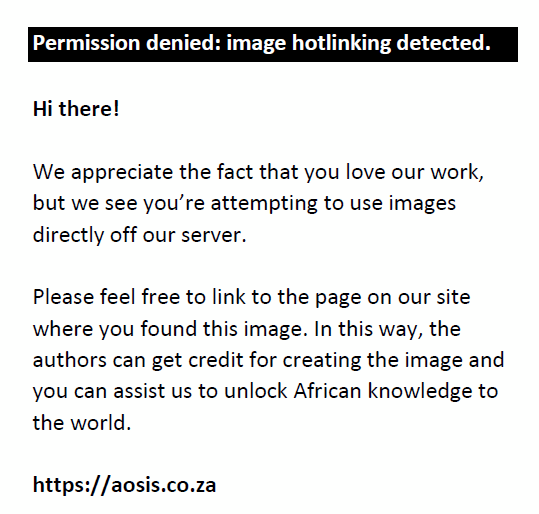
Where 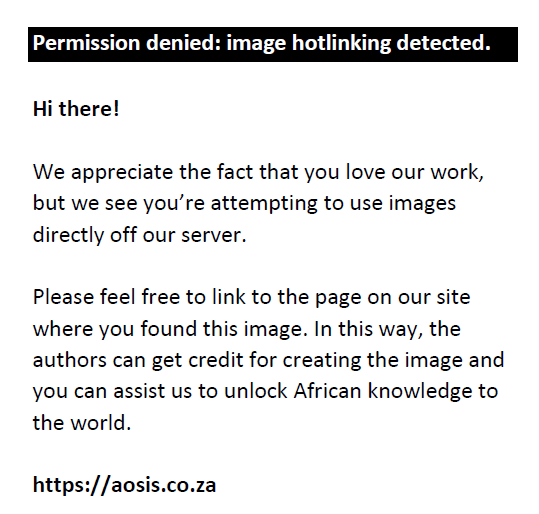 denotes standardised residuals from a distribution F, pA ≥ 0, qA ≥ 0, |λi| < 1, |ψi| < 1, p ≥ 0, q > 0, ω > 0, γi ≥ 0 and βi ≥ 0 (Ruppert 2011). The ARIMA-GARCH model coefficients are estimated with the Statsmodels and ARCH_model software libraries in Python using maximum likelihood estimation. Stationarity is confirmed with the Augmented Dickey–Fuller (ADF) test. The autocorrelation (ACF) and partial autocorrelation (PACF) functions confirm that autocorrelations are adequately captured. denotes standardised residuals from a distribution F, pA ≥ 0, qA ≥ 0, |λi| < 1, |ψi| < 1, p ≥ 0, q > 0, ω > 0, γi ≥ 0 and βi ≥ 0 (Ruppert 2011). The ARIMA-GARCH model coefficients are estimated with the Statsmodels and ARCH_model software libraries in Python using maximum likelihood estimation. Stationarity is confirmed with the Augmented Dickey–Fuller (ADF) test. The autocorrelation (ACF) and partial autocorrelation (PACF) functions confirm that autocorrelations are adequately captured.
The standardised residuals ηt are converted to Uniform [0,1]-variables using the probability integral transform and empirical cumulative distribution functions. Bivariate Archimedean copulas are fitted to the transformed standardised residuals of the variable-pairs.
Archimedean copulas are constructed with a generator function φ:
where φ−1 denotes the pseudo-inverse function and u1, u2 in I = [0, 1] The generator functions considered in this study are summarised in Table 2 and were sourced from Nelsen (2006). An algorithm was developed to estimate the parameters of all the copulas and then select the best-fit Archimedean copula based on the Kolmogorov–Smirnov test statistic that compares the distribution function  of the random variable C(U1, U2) with its non-parametric counterpart. All the algorithms used in this study have been developed in Python. of the random variable C(U1, U2) with its non-parametric counterpart. All the algorithms used in this study have been developed in Python.
| TABLE 2: Summary of the Archimedean copulas, generating functions and the type of dependence captured by the copula. |
The bivariate Archimedean copulas are fitted to the variable-pairs over time to test for significant changes in the type of dependence as well as the strength of the relationship as captured by the copula parameter α. Higher values of α are associated with higher correlation.
The Pearson linear correlation statistic is calculated on the variables converted to ranks as this is equivalent to the Spearman rank correlation statistic (Forthofer, Lee & Hernandez 2006). Rank correlation is a more accurate reflection of the relationship between non-Gaussian variables.
Results: ARIMA-GARCH filter
The ARIMA-GARCH model is used to filter non-stationary trends and time-dependent volatility before analysing the trends in the dependence structures. The ADF test statistic confirmed the stationarity of the variables. Table 3 summarises the ARIMA-GARCH coefficients following the notation as outlined in Equations 1–3. All estimated parameters are statistically significant.
| TABLE 3: Summary of the estimated coefficients of the ARIMA (pA, d, qA)–GARCH (p, q) models. |
Results: Dependence structures of emerging market currency-pairs
The dependence structures of four emerging market currency pairs are examined in this study. Figure 5 shows the Pearson linear correlation between ZAR versus BRL, INR, RUB and TRY, respectively. The correlations vary significantly over time and there are notable shifts in the level of correlation in certain instances. The correlation between ZAR and BRL hovered around 65% between 2008 and 2012 and from 2013 to 2022 the average level reduced to 50%. There is a strong downward trend in the correlation between ZAR and TRY. The algorithm described in ‘Methodology’ section was used to find the best-fit copula for each period.
 |
FIGURE 5: Pearson linear correlation between selected emerging market currency-pairs calculated over a rolling 6-month period (a–d). |
|
Figure 6 shows the contour plots of the dependence structures for ZAR-TRY during the two stress periods. The darker areas on the plot indicate higher concentrations of observations. The Genest–Ghoudi copula captures the dependence structure for the 6-month period ending June 2009, and the Ali-Mikhail-Haq copula covers the 6-month period ending June 2020. The plots illustrate how diverse the dependence structures are during different stress periods. In 2009, the Genest-Ghoudi copula captures strong upper-tail dependence in contrast to 2020 where no tail dependence is observed. The observed correlation in 2020 did not spike to the 2009 levels.
 |
FIGURE 6: Contour plots of the dependence structures observed for ZAR and TRY where the Genest–Ghoudi copula covers the 6-month period ending June 2009, and the Ali-Mikhail-Haq copula the 6-month period ending June 2020 (a-b). |
|
Figure 7 shows the contour plots for the ZAR-BRL currency pair for the same two stress periods. The Frank copula captures the dependence in the 2009 period and does not exhibit any tail-dependence, whereas the Gumbel used for the 2020 period captures upper-tail dependence.
 |
FIGURE 7: Contour plots of the dependence structures observed for ZAR and BRL where the Frank copula covers the 6-month period ending June 2009 and the Gumbel copula the 6-month period ending June 2020 (a–b). |
|
The dependence between both the ZAR-TRY and ZAR-BRL currency pairs reduced when comparing the 2009 with the 2020 stress periods.
Results: Dependence structures between stock price and commodity
There are companies whose earnings are highly exposed to the performance of commodities. In this section, two such examples are considered: the gold mining company AngloGold Ashanti (ANG) and Sasol (SOL), a chemicals and energy company.
The dependence structure between ANG and XAU is shown in Figure 8. The same Gumbel copula captures the dependence structure for both the 2009 and 2020 stress periods. The Gumbel copula captures upper-tail dependence. This indicates stronger dependence when ANG and XAU increase in value and less dependence when they lose value.
 |
FIGURE 8: Contour and scatter plots of the dependence structures observed for AngloGold Ashanti (ANG) and XAU during the 2009 and 2020 stress periods (a-b). |
|
During 2020, the gold price rose significantly on the back of global investor demand driven by the uncertainty caused by the pandemic. The higher gold price had a positive impact on the ANG stock price. Higher demand for gold during stress periods explains why the same type of dependence and strength of relationship is observed during both stress periods (2009 and 2020).
Next, the relationship between the SOL stock price and Brent crude oil is analysed. The decline in the Brent crude oil price and lower product demand during the pandemic had a negative impact on the SOL stock price. Figure 9 shows the Pearson linear correlation between SOL and OIL calculated over rolling 6-month periods from 2008 to 2010. During the 2009–2010 global financial crisis, the correlation spiked twice to just over 50%. The correlation increased during the first half of 2020 at the onset of the pandemic, but then decreased substantially when the oil price and stock price started to diverge.
 |
FIGURE 9: Pearson linear correlation between Sasol (SOL) and OIL over rolling 6-month periods from 2008 to 2010 covering the COVID-19 pandemic (a-b). |
|
Figure 10 shows the contour plots of the dependence structures of SOL and OIL for two periods during financial stress. The N14-copula generally captures both upper- and lower-tail dependence and is used to model the 6-month ending June 2010. The Ali-Mikhail-Haq copula captures no tail dependence and is used to model the dependence for the 6-month ending December 2020.
 |
FIGURE 10: Contour plots of the dependence structures observed for Sasol (SOL) and OIL where the N14-copula is used to model the 6-month period ending June 2010 and the Ali-Mikhail-Haq copula captures the dependence for the 6-month period ending December 2020 (a-b). |
|
Results: Dependence structures between currency and bond yield
The short-term relationship between ZAR and SABOND10 is relatively stable over time except during stress periods. Figure 11 shows the rolling 3-month Pearson linear correlation. During 2013 to 2019 the correlation generally fluctuated around a 50% average level, but during 2020 there is a correlation break. In 2020, the South African market experienced significant volatility because of the pandemic; a sovereign credit rating downgrade to sub-investment grade; and the exclusion of South Africa from the World Government Bond Index. Investors migrated to safe-haven assets, and the risk appetite changed from long- to short-term investments. The South African government responded with bond buys-backs to ensure continued market stability (Tsatsaronis et al. 2022). The government intervention explains the observed correlation break.
 |
FIGURE 11: Pearson linear correlation between SABOND10 and ZAR over rolling 3-month periods from 2008 to 2022. |
|
Figure 12 shows that during the periods of more stable market conditions, the relationship between ZAR and SABOND10 is captured by the Frank copula. The Frank copula does not allow for tail-dependence.
 |
FIGURE 12: Contour plot of the dependence structure observed for SABOND10 and ZAR from 2013 to 2019 where the Pearson linear correlation has been generally stable around the 50% level. |
|
Summary
Currency pair dependence structures fluctuate over time, with no consistency between different stress periods. Market stress does not automatically lead to higher observed tail dependence.
Econometric models frequently fail during economic downturns because they were designed under different macroeconomic conditions. A way to manage this risk is to develop bespoke models for the different segments of the economic/business cycle. However, given the heterogeneity in dependence structures across stress periods, it is unclear how effective such an approach would be.
The relationship between the stock price of companies whose earnings are significantly dependent on commodity performance and the underlying commodity price displays intuitive behaviour. Higher demand for gold during stress periods has a positive impact on the stock price of the gold mining company. The relationship is stable between different stress periods. This is not the case for SOL and the underlying oil price. There was a correlation break during 2020 with the correlation reaching almost zero and then steadily increasing again to around 30% in 2022. Earnings is one of the variables used when assessing the creditworthiness of a corporate entity. In this example, the corporate entity continued to perform well as measured by the stock price, despite the drop in the price of the underlying commodity that affects the company’s earnings. If this relationship is used in the IFRS 9 impairment model, the lower commodity price would have predicted lower earnings and thus higher credit risk, which leads to the expected loss estimate to be overstated.
The short-term relationship between ZAR and SABOND10 is relatively stable over time, except during stress periods when the correlation decreases significantly and is more volatile. The 2020 correlation break is explained by government intervention to ensure the stability of the market with bond buy-backs. This analysis shows it is incorrect to assume that correlation always increases during a stress period.
The analyses in this section show how the type and degree of dependence between variables evolve over time. The observed behaviour in one stress period cannot necessarily be used to extrapolate the behaviour in another stress period. Understanding the market dynamics and the reasons behind observed trends is critical.
Concluding remarks
Periods of financial stress are often followed by more stringent regulations for the banking sector to ensure the continued stability of the financial system. Lessons learned from the 2009 global financial crisis led to updated regulations around regulatory capital. The updated regulations required higher quality of capital; more risk coverage; an increased level of the minimum capital; greater supervisory reviews; and managing procyclicality with the build-up of capital buffers in good times that can be accessed during economic downturns (Basel Committee on Banking Supervision 2010). The concerns around procyclicality were also addressed by IASB with the issue of the IFRS 9 accounting standard to ensure the timely recognition of expected credit losses (IASB 2001, 2014). The COVID-19 pandemic shifted the focus to climate risk. Barouki et al. (2021) highlight the linkages between pandemics and environmental factors such as climate change, pollution, urbanisation and unsustainable consumption. Regulators are responding with new requirements to incorporate the effects of climate risk into the Bank’s risk management function and financial disclosures (Basel Committee on Banking Supervision 2021).
This study explored the market events during the COVID-19 pandemic in 2020 and evaluated the reasons for the IFRS 9 model failures experienced during this period. Government intervention played a big role. Lockdowns to manage the spread of the virus had significant impacts on the global economy. Market shutdowns led to economic behaviour never experienced before, partly explained by behavioural finance theory that postulates how emotions can lead to irrational investment decisions with disastrous consequences. The impact of social media on market sentiment and the causal impact on economic volatility offers many opportunities for future research.
The first part of this study considered how market sentiment evolved during the stress period by analysing economic texts published by organisations such as the World Bank, IMF and OECD. The sentiment analysis shows how the global economic outlook shifted from concerns around global trade in 2019 to the pandemic in 2020 and then finally the Russia–Ukraine war in 2022. The sentiment score may be a valuable exogenous variable to incorporate in an economic forecast model, based on the trends observed in the sentiment analysis of the OECD economic outlook for South Africa. This has implications for how the required IFRS 9 forward-looking data are generated. Models may be enhanced to not only capture objective information from historical trends, but also the subjective information from market sentiment that is quantitatively assessed. Currently subjective views are mainly incorporated with expert overlays.
The second part of this study looked at how bivariate dependent structures changed over time for selected currencies, stocks, commodities and interest rates. It was shown that the type and level of dependence change over time. Countercyclical government intervention caused unexpected correlation shifts that not only impacted the econometric models used to produce the IFRS 9 forward-looking information but also on the models used to assess the creditworthiness of clients. Volatility in impairments has a negative impact on the earnings quality of the bank. The divergence of dependence structures between different stress periods indicates that developing a model on one stress period will not necessarily lead to improved extrapolated outcomes during another stress period.
The focus of this study was on the econometric models used for IFRS 9. However, forecast models are essential in policy response, nowcasting, and as an early warning system to predict financial crisis. Incorporating climate risk into the banking models is the next big challenge. Adoption of an effective model risk framework is important.
Acknowledgements
Competing interests
The author has declared that no competing interests exist.
Author’s contributions
I declare that I am the sole author of this research article.
Ethical considerations
This article followed all ethical standards for research without direct contact with human or animal subjects.
Funding information
This research received no specific grant from any funding agency in the public, commercial or not-for-profit sectors.
Data availability
All data and sources are disclosed in the document.
Disclaimer
The views and opinions expressed in this article are those of the authors and do not necessarily reflect the official policy or position of any affiliated agency of the author.
References
Araci, D.T., 2019, ‘FinBERT: Financial sentiment analysis with pre-trained language models’, Master Dissertation, Faculty of Science, University of Amsterdam, viewed April 2022, from https://arxiv.org/pdf/1908.10063.pdf.
Aslam, F., Mughal, K.S., Aziz, S., Ahmad, M.F. & Trabelsi, D., 2022, ‘COVID-19 pandemic and the dependence structure of global stock markets’, Applied Economics 54(18), 2013–2031. https://doi.org/10.1080/00036846.2021.1983148
Awad, R., Ferreira, C., Gaston, E. & Riedweg, L., 2020, Banking sector regulatory and supervisory response to deal with coronavirus impact, Special Series on Covid-19, Monetary and Capital Markets, IMF, viewed April 2022, from https://www.imf.org/-/media/Files/Publications/covid19-special-notes/enspecial-series-on-covid19banking-sector-regulatory-and-supervisory-response-to-deal-with-coronavir.ashx.
Barouki, R., Kogevinas, M., Audouze, K., Belesova, K., Bergman, A., Birnbaum, L. et al., 2021. ‘The COVID-19 pandemic and global environmental change: Emerging research needs’, Environment International 146, 106272. https://doi.org/10.1016/j.envint.2020.106272
Basel Committee on Banking Supervision, 2010, The Basel Committee’s response to the financial crisis: Report to the G20, Bank for International Settlements, viewed April 2022, from https://www.bis.org/publ/bcbs179.pdf.
Basel Committee on Banking Supervision, 2021, Principles for the effective management and supervision of climate-related financial risks, Consultative Document, Bank for International Settlements, viewed April 2022, from https://www.bis.org/bcbs/publ/d530.pdf.
Bilan, Y., Brychko, M., Buriak, A. & Vasilyeva, T., 2019, ‘Financial, business and trust cycles: The issues of synchronization, Faculty of Economics and Business, University of Rijeka’, Journal of Economics and Business 37(1), 113–138. https://doi.org/10.18045/zbefri.2019.1.113
Bird, S., Klein, E. & Loper, E., 2009, Natural language processing with Python. O’Reilly Media Inc., viewed April 2022, from https://www.nltk.org/book/.
Bonta, V., Kumaresh, N. & Janardhan, N., 2019, ‘A comprehensive study on Lexicon based approaches for sentiment analysis’, Asian Journal of Computer Science and Technology 8(2), 1–6. https://doi.org/10.51983/ajcst-2019.8.S2.2037
Breeden, J.L., Brotcke, L., Duan, B., Johnson, A., Maner, C. & O’Neil, P., 2021, Impacts of Covid-19 on Model Risk Management, Technical Report, 2021-01, Model Risk Managers’ International Association, viewed April 2022, from https://mrmia.org/wp-content/uploads/2021/05/MRMIA-Impacts-of-COVID-19-on-Model-Risk-Management-v1.0-compressed.pdf.
Canals-Cerda, J.J., 2022, CECL Implementation and model risk during the pandemic, Research Report, Federal Reserve Bank of Philadelphia, viewed April 2022, from https://www.philadelphiafed.org/-/media/frbp/assets/institutional/banking/surf/spotlights/2022/surf_2022_q3-spotlight.pdf.
Consoli, S., Barbaglia, L. & Manzan, S., 2022, ‘Fine-grained, aspect-based sentiment analysis on economic and financial lexicon’, Knowledge-Based Systems 247, 108781. https://doi.org/10.1016/j.knosys.2022.108781
Dong, X., Song, L. & Yoon, S.M., 2021, ‘How have the dependence structures between stock markets and economic factors changed during the COVID-19 pandemic?’, The North American Journal of Economics and Finance 58, 101546. https://doi.org/10.1016/j.najef.2021.101546
European Banking Authority, 2021, IFRS 9 Implementation by EU institutions, Monitoring Report, EBA/Rep/2021/35, November, viewed April 2022, from https://www.eba.europa.eu/sites/default/documents/files/document_library/Publications/Reports/2021/1024609/IFRS9%20monitoring%20report.pdf.
Forthofer, RN., Lee, ES. & Hernandez, M., 2006, Biostatistics: A Guide to Design, Analysis and Discovery, Elsevier Inc., California.
Global Public Policy Committee, 2016, The implementation of IFRS 9 impairment requirements by banks: Considerations for those charged with governance of systemically important banks, viewed April 2022, from https://www.ey.com.
Hendry, D.F., 2017, Imperfect knowledge, unpredictability and the failures of modern macroeconomics, Economics Department and Institute for New Economic Thinking, Oxford Martin School, University of Oxford, viewed April 2022, from https://www.ineteconomics.org/uploads/papers/HENDRY-INETEdin17.pdf.
Hendry, D.F. & Pretis, F., 2016, All change! The implications of non-stationarity for empirical modelling, forecasting and policy, Policy Paper, Oxford Martin School, University of Oxford, viewed April 2022, from https://www.oxfordmartin.ox.ac.uk/downloads/briefings/All_Change.pdf.
International Accounting Standards Board (IASB), 2001, IAS 39 financial instruments: Recognition and measurement, viewed April 2022, from https://www.ifrs.org/issued-standards/list-of-standards/ias-39-financial-instruments-recognition-and-measurement/.
International Accounting Standards Board (IASB), 2014, IFRS 9: Financial instruments, viewed April 2022, from https://www.ifrs.org/issued-standards/list-of-standards/ifrs-9-financial-instruments/.
International Monetary Fund, 2008–2022, World economic outlook, Report, Semi-annually, International Monetary Fund, viewed April 2022, from https://www.imf.org/.
Kapoor, S. & Prosad, J.M., 2017, ‘Behavioural finance: A review’, Procedia Computer Science 122, 50–54. https://doi.org/10.1016/j.procs.2017.11.340
Kiefer, H. & Mayock, T., 2020, Why do models that predict failure fail?, Working Paper, Federal Deposit Insurance Corporation, Center for Financial Research, FDIC CFR WP 2020-05, viewed April 2022, from https://www.fdic.gov/analysis/cfr/working-papers/2020/cfr-wp2020-05.pdf.
Kim, J.-M. & Jung, H., 2021, ‘The impacts of COVID-19 on the dependence structure of the stock market’, Applied Economics Letters. https://doi.org/10.1080/13504851.2021.1996526
Laurent, M.-P., Plantefève, O., Tejada, M. & Van Weyenbergh, F., 2020, Banking models after COVID-19: Taking model-risk management to the next level, Risk & Resilience Insights, McKinsy&Company, viewed April 2022, from https://www.mckinsey.com/business-functions/risk-and-resilience/our-insights/banking-models-after-covid-19-taking-model-risk-management-to-the-next-level.
Lazzini, A., Lazzini, S., Balluchi, F. & Mazza, M., 2022, ‘Emotions, moods and hyperreality: Social media and the stock market during the first phase of COVID-19 pandemic’, Accounting, Auditing & Accountability Journal 35(1), 199–215. https://doi.org/10.1108/AAAJ-08-2020-4786
Marlin, S., 2021, EBA warns banks over loan-loss model tinkering, November, Risk.net, viewed April 2022, from https://www.risk.net/risk-management/7901436/eba-warns-banks-over-loan-loss-model-tinkering.
Mzoughi, H., Ghabri, Y. & Guesmi, K., 2022, ‘Crude oil, crypto-assets and dependence: the impact of the COVID-19 pandemic’, International Journal of Energy Sector Management, https://doi.org/10.1108/IJESM-10-2021-0016
Nelsen, R.B., 2006, An introduction to copulas, 2nd edn., Springer Science Business Media, New York.
Organization for Economic Co-operation and Development (OECD), 2016–2022, Economic outlook, Research Report, viewed April 2022, from https://www.oecd-ilibrary.org/economics/oecd-economic-outlook_16097408.
Paule-Vianez, J., Gómez-Martínez, R. & Prado-Román, C., 2020, ‘A bibliometric analysis of behavioural finance with mapping analysis tools’, European Research on Management and Business Economics 26 (2), 71–77. https://doi.org/10.1016/j.iedeen.2020.01.001
Python Core Team, 2019, Python: A dynamic, open source programming language, Python Software Foundation, viewed April 2022, from https://www.python.org/.
Ruppert, D., 2011, Statistics and data analysis for financial engineering, Springer Texts in Statistics, Springer Science and Business Media, New York.
Shiller, R.J., 2017, ‘Narrative economics’, American Economic Review 107(4), 967–1004. https://doi.org/10.1257/aer.107.4.967
S&P Global Market Intelligence, 2022, Industries most and least impacted by COVID-19 from a probability of default perspective – January 2022 update, Blog Post, viewed April 2022, from https://www.spglobal.com/marketintelligence/en/news-insights/blog/industries-most-and-least-impacted-by-covid-19-from-a-probability-of-default-perspective-january-2022-update.
Stander, Y.S., 2021, ‘Quantifying the Sources of Volatility in the IFRS 9 Impairments’, South African Journal of Accounting Research, 35(3), 191–218. https://doi.org/10.1080/10291954.2021.1885242
Stiglitz, J.E., 2018, ‘Where modern macroeconomics went wrong’, Oxford Review of Economic Policy 34(1–2), 70–106. https://doi.org/10.1093/oxrep/grx057
Svetlova, E., 2021, ‘AI meets narratives: The state and future of research on expectation formation in economics and sociology’, Socio-Economic Review 20(2), 841–861. https://doi.org/10.1093/ser/mwab033
Tilly, S., Ebner, M. & Livan, G., 2021, ‘Macroeconomic forecasting through news, emotions and narrative’, Expert Systems with Applications 175, 114760. https://doi.org/10.1016/j.eswa.2021.114760
Tsatsaronis, K., Chui, M., Goel, T. & Mehrotra, A., 2022, The monetary-fiscal policy nexus in the wake of the pandemic, Working Paper, Bank for International Settlements, BIS Papers No 122, viewed April 2022, from https://www.bis.org/publ/bppdf/bispap122.pdf.
World Bank, 2019, Global economic prospects, World Bank, Washington, DC, viewed April 2022, from https://openknowledge.worldbank.org/handle/10986/31066.
World Bank, 2020, Global economic prospects, World Bank, Washington, DC, viewed April 2022, from https://openknowledge.worldbank.org/handle/10986/33748.
|